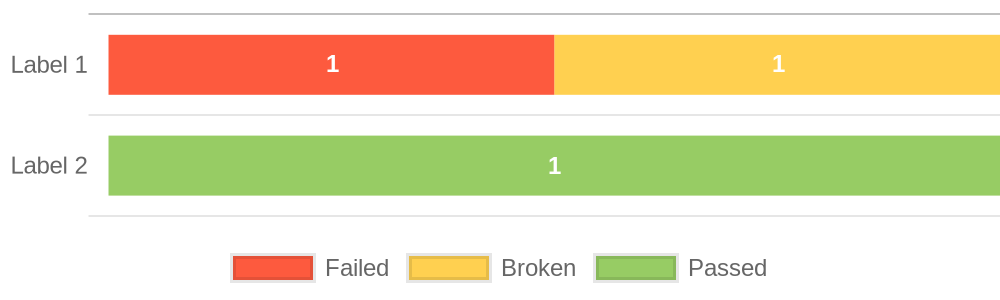
I’ve been struggling to create a 100% stacked horizontal bar graph like the one below. Any help would be much appreciated.

  <canvas id="myChart" width=50 height=10></canvas>
  <script>
chart = new Chart(document.getElementById("myChart"), {
  type: "bar",
  data: {
    labels: ["Label 1", "Label 2"],
    datasets: [
      { label: "Failed", data: [1, 0], backgroundColor: "rgba(253, 90, 62, 1.0)" },
      { label: "Broken", data: [1, 0], backgroundColor: "rgba(255, 208, 80, 1.0)" },
      { label: "Passed", data: [1, 1], backgroundColor: "rgba(151, 204, 100, 1.0)" },
    ],

  },
  options: {
    indexAxis: "y",
    plugins: {
      stacked100: { enable: true },
    },
  },
});

var image = chart.toBase64Image();
console.log(image);
<script>

Using stacked100 chartjs plugin I could make this. Its not perfect, but I’m getting there
Hi @mplnv, the approach for 100% horizontal bar charts is a bit strange without the plugin, but it’s certainly doable. The key is to use a horizontalBar and set arrays of backgroundColors. I put this together before your followup post but it should help a bit. Let me know if you have followup questions.
Here’s the example with Chart.js v2:
{
  type: 'horizontalBar',
  data: {
    labels: ['Label 1', 'Label 2'],
    datasets: [
      {
        backgroundColor: ['#fd5a3e', null],
        data: [0.5, null],
        barThickness: 30,
      },
      {
        backgroundColor: ['#ffd050', '#97cc64'],
        data: [0.5, 1.0],
        barThickness: 30,
      },
    ],
  },
  options: {
    legend: {
      position: 'bottom',
      labels: {
        generateLabels: (chart) => [
          {
            text: 'Failed',
            fillStyle: '#fd5a3e',
          },
          {
            text: 'Broken',
            fillStyle: '#ffd050',
          },
          {
            text: 'Passed',
            fillStyle: '#97cc64',
          },
        ],
      },
    },
    scales: {
      xAxes: [
        {
          stacked: true,
          ticks: { min: 0, max: 1, display: false },
          gridLines: { display: false },
        },
      ],
      yAxes: [{ stacked: true, gridLines: { drawBorder: false } }],
    },
    plugins: {
      datalabels: {
        display: true,
        color: '#fff',
        font: {
          style: 'bold',
        },
        formatter: () => {
          return '1';
        },
      },
    },
  },
};
@ian thank you very much. Initially I was trying it with v2 only but I couldn’t do it without the plugins. Yes the approach is a bit strange, when the numbers change the data has to be sliced and fed to the graph. Anyway I thought it was impossible to do but you proved me wrong. Thank you very much for the help.
This is the chart I created with Charts v3.

And here’s the code.
<script src=https://cdn.jsdelivr.net/npm/chart.js@3.0.0/dist/chart.min.js></script>
<script src=https://cdn.jsdelivr.net/npm/chartjs-plugin-stacked100@1.0.0></script>
<script src=https://cdn.jsdelivr.net/npm/chartjs-plugin-datalabels@2.0.0></script>
<canvas id="myChart" style="position: relative; height:150; width:500"></canvas>
<script>
Chart.register(ChartjsPluginStacked100.default);
Chart.register(ChartDataLabels);
const chart = new Chart(document.getElementById("myChart").getContext("2d"), {
	type: "bar",
	data: {
		labels: ["Label 1", "Label 2"],
		datasets: [
			{ label: "Failed", data: [2, 0], backgroundColor: "rgba(253, 90, 62, 1.0)" },
			{ label: "Broken", data: [1, 0], backgroundColor: "rgba(255, 208, 80, 1.0)" },
			{ label: "Passed", data: [0, 125], backgroundColor: "rgba(151, 204, 100, 1.0)" }]
	},
	options: {
		scales: {
			x: { display: false },
			y: { grid: { drawBorder: false }}
		},
		maintainAspectRatio: false,
		responsive: false,
		indexAxis: "y",
		plugins: {
			stacked100: { enable: true },
			datalabels: {
				anchor: 'center',
				align: 'center',
				formatter: (_value, context) => {
					const {
						datasetIndex, dataIndex
					} = context;
					const rawValue = context.chart.data.originalData[datasetIndex][dataIndex];
					return rawValue || "";
				},
				color: '#FFFFFF',
				font: {
					weight: 'bold'
				},
			},
			legend: {
				display: true,
				position: 'bottom',
			},
		},
	},
});
var image = chart.toBase64Image();
console.log(image);
</script>
Do you have an example URL? I’d suggest URL encoding the chart config instead of base64 encoding it.