I want to add some quadrants to a scatter plot chart modifying the X and Y axis into it. Is is possible through this API?
Hi @Djancano,
Yes, see the quadrants example here

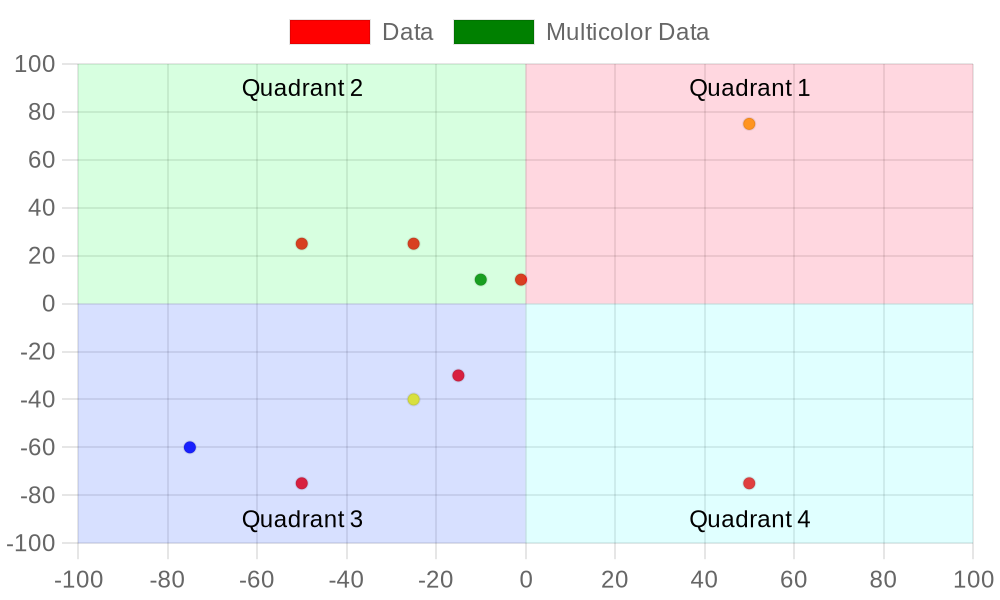