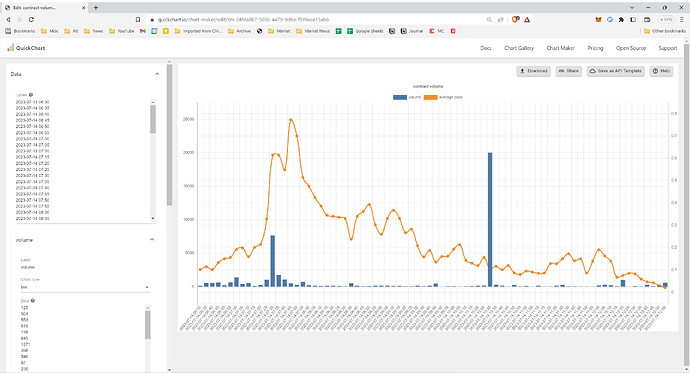
Here’s a chart with two datasets:
I’d like have the orange one use an axis on the right. However, when I set the yAxis property to Y2, I get a blank page:
Now, interestingly, if I switch to the editor, I notice this message in the lower left:
Then if I manually switch the Axis for the ‘average price’ dataset to Y2, the chart shows up:
Is there something else I should specify in the JSON to get the Y2 axis to work?
Thanks!
Ed
OK, got it to work!
Here’s the code I used (PowerShell):
$json = @{
    chart = @{
        type = 'bar'
        data = @{
            labels = $result_candles.results | Select-Object $field_timestamp_alt | % timestamp
            datasets = @(
                @{ label = 'volume';        data = $result_candles.results | % v }
                @{ label = 'average price'; data = $result_candles.results | % vw; yAxisID = 'Y2'; type = 'line'; fill = $false }
            )
        }
        options = @{
            title = @{ display = $true; text = 'contract volume' }
            scales = @{

                yAxes = @(
                    @{ id = 'Y1'; position = 'left';  display = $true }
                    @{ id = 'Y2'; position = 'right'; display = $true }
                )

            }
        }
    }
} | ConvertTo-Json -Depth 100
Looks like I needed to explicitly setup Y1 and Y2 in the yAxes property.
1 Like


