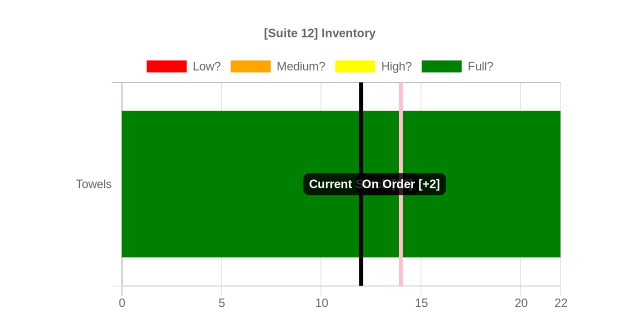
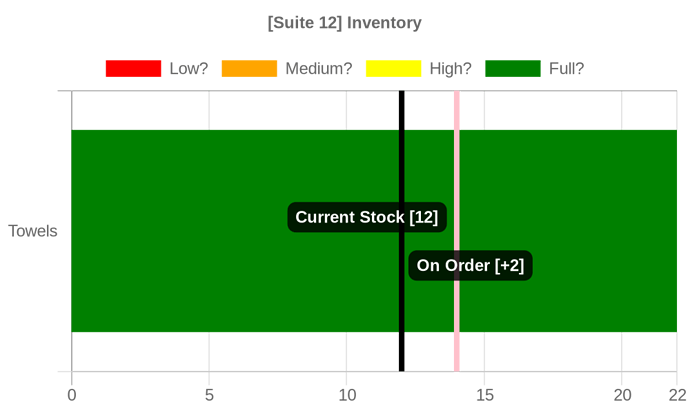
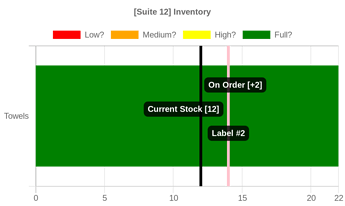
As you can see in the image below, the two labels are overlapping each other.

I’ve been searching the documentation, both for QuickChart and the chartJS plugins, but can’t find anything that actually moves the label up or down the line - they always sit in the middle.
Is there a way to move these annotation labels in a chart like this?
Thanks so much! ![]()
Here's the code driving this chart:
{
  type: "horizontalBar",
  data: {
    labels: ["Towels"],
    datasets: [
      {
        label: "Low?",
        backgroundColor: "red",
        stack: "Stack 1",
        data: [],
      },
      {
        label: "Medium?",
        backgroundColor: "Orange",
        stack: "Stack 1",
        data: [0],
      },
      {
        label: "High?",
        backgroundColor: "yellow",
        stack: "Stack 1",
        data: [0],
      },
      {
        label: "Full?",
        backgroundColor: "Green",
        stack: "Stack 1",
        data: [22]
      },
	]
  },
  options: {
    title: {
      display: true,
      text: "[Suite 12] Inventory",
    },
    annotation: {
      annotations: [
      {
        type: "line",
        mode: "vertical",
        scaleID: "x-axis-0",
        value: 12,
        borderColor: "black",
        borderWidth: 4,
        label: {
          enabled: true,
          content: "Current Stock [12]"
        }
      },
     	{
        type: "line",
        position: '24%',
        mode: "vertical",
        scaleID: "x-axis-0",
        value: 14,
        borderColor: "Pink",
        borderWidth: 4,
        label: {
          enabled: true,
          content: "On Order [+2]"
        }
      }
      ]
    },
    scales: {
      xAxes: [
        {
          stacked: true,
          ticks: {
          	max: 22
          }
        }
      ]
    }
  }
}
- It’s the second annotation I’m wanting to modify, the “pink” line
- I tried using ‘position’, but it did nothing.

- I tried using ‘position’, but it did nothing.


